Dynamics and Markov Analysis
Dynamics
Levels of pLQ can be considered as levels of LQ corrected by size effects. This section explores the persistence of pLQ levels through a Markovian transitions analysis. It reveals that pLQ levels near 0 and 1 are stable, while transitions between these extremes often involve intermediate values.
Figure 1 below illustrates the relationship between (horizontal axis) and (vertical axis), resembling an empirical Markov matrix. Key observations include:
- Stability: Very low and high pLQ levels tend to remain stable over time.
- Volatility: Intermediate pLQ levels exhibit higher volatility, with significant chances of varying outcomes over time.
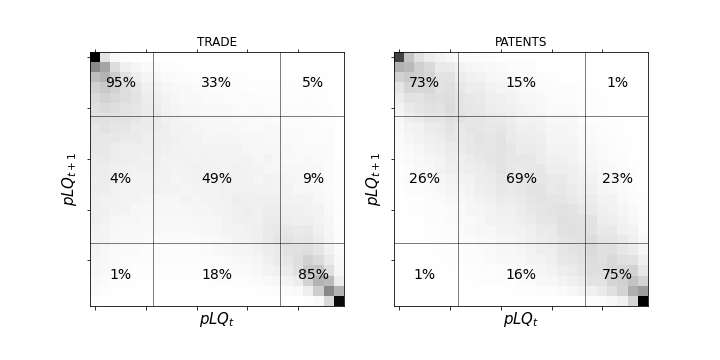
Figure 1: Plot of an empirical Markov matrix showing pLQ next year as a function of pLQ this year. Both extremes show persistence, while the values in the middle show high volatility. The gray intensity denotes percentage probability in the Markov cell, from 0% (white) to 100% (black).
Categorizing pLQ Levels
By partitioning pLQ into three categories, we can derive further insights:
- Low values:
- Medium or transition values:
- High values:
This categorization allows the computation of a Markov matrix, revealing:
- Significant probabilities of transitions between categories 1 and 2, and between categories 2 and 3.
- Reduced probabilities of direct transitions between categories 1 and 3 without passing through 2.
This suggests an ordering in LQ values, where the transition category acts as a stage for country-products moving between no-advantage and advantage statuses.
Implications for Network Analysis
Studies using for defining binary matrices and bipartite networks can leverage pLQ for a weighted bipartite network. This Markov analysis confirms that pLQ levels can define categorical values {low, mid, high} instead of binary {0, 1} values.