Appendix II: Accounting Variance by Frequency
Appendix II: Accounting Variance by Frequency
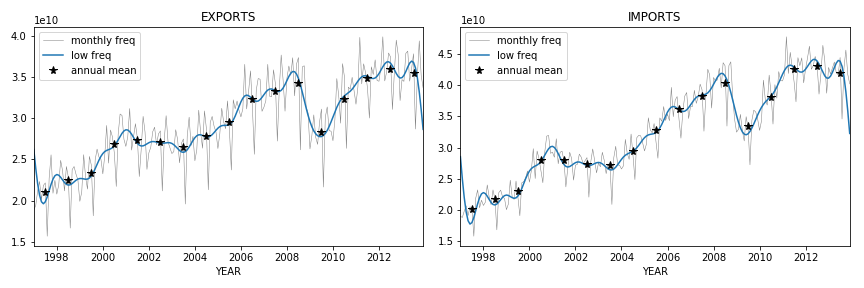
The focus of this section is on time series with an annual frequency. A common question is whether measuring the same variables at a higher frequency significantly alters the observed volatility. The answer is that most of the variation in aggregate sales over time is explained by low-frequency components, i.e., cycles longer than a year, which are well captured in annual data. This suggests that measuring volatility on annual time series is a reasonable choice, although some additional volatility linked to seasonal changes might be missed.
To explore this issue, we present the expression for our problem in terms of Fourier series, allowing comparability with approaches by Dupor and Horvath.
The time series considered here have a monthly frequency over years, resulting in a length of . They can be expressed as:
where is the wave number (minimum to maximum wave frequency), is a vector of time steps, and is the -th element of the Fourier transform of divided by , defined as:
Alternative conventions to express these are also valid. From here, we can associate a magnitude of volatility to each frequency by their amplitude in the equation above, i.e., by the magnitude of , excluding the zero frequency component. This is:
We have information on the monthly disaggregation of exports and imports to assess whether most variation is explained by low or high-frequency components. These are illustrated in the plots of Figure 1. Annual and lower frequencies are termed low, while frequencies higher than annual are termed high. The only significant high-frequency components are related to seasonal patterns (six months, quarters, two months, etc.). For imports, annual or lower frequencies account for 90% of variance, while for exports, this figure is 75%.
This result supports the study of variance in annual time series as a fair representation of variance even in higher frequency measurements. Eventually, we might want to add a contribution to aggregate volatility from seasonality, but this is not problematic and is excluded from the rest of the analysis.